If you’re just starting out in data analytics, one of the first things that overwhelms beginners isn’t the math — it’s the sheer number of tools everyone seems to be using. SQL, Excel, Python, Power BI, Tableau… where do you even begin?
Here’s the good news: youdon’t need to master all of them on day one. Mostworking data analysts rely on a small, predictable combination of tools, each doing a specific job. This guide breaks down what each tool is actually used for in a real analyst’s day-to-day work, so you know exactly where to focus your learning energy.
1. SQL — The Daily Workhorse
If there’s one skill that shows up in almost every data analyst job description, it’s SQL (Structured Query Language). Nearly every company stores its data in a database, and SQL is how you talk to that database.
What you’ll actually use it for:
• Pulling specific records from massive datasets (millions of rows) in seconds
• Filtering, sorting, and joining data from multiple tables
• Aggregating data — totals, averages, counts — grouped by category, region, or time period
• Writing repeatable queries that stakeholders can request updates on
Unlike Excel, SQL doesn’t struggle when your dataset has millions of rows. That scalability is exactly why it’s considered the backbone of a data analyst’s toolkit — it’s usually the very first stop when a business question needs to be answered.
Where to practice: Platforms like HackerRank, LeetCode, and Mode Analytics offer free SQL practice environments with real-world style problems — a great way to build query intuition beyond just syntax memorization.
2. Excel — The Last-Mile Deliverable
Excel might feel “basic” compared to a programming language, but don’t underestimate it. It remains one of the most requested skills in analyst job postings, largely because it’s where a lot of analysis actually gets presented to non-technical stakeholders.
What you’ll actually use it for:
• Quick, ad-hoc analysis when you don’t need a full script or query
• Pivot tables for fast summarization and cross-tabulation
• Building dashboards for managers who live inside spreadsheets
• Formula auditing, data validation, and cleaning smaller datasets
• Sharing final, polished reports that non-technical teams can open instantly. Think of Excel as the “last mile” of your analysis — even if you pulled and processed the data in SQL or Python, it often gets summarized and delivered in Excel because that’s the format decision-makers are comfortable with.
3. Python (with pandas) — For Scale and Automation
Python enters the picture when your analysis needs to go beyond what SQL and Excel cancomfortablyhandle— think statisticalmodeling, automation, orprocessingmessy, unstructured data.
What you’ll actually use it for:
• Automating repetitive reporting tasks (no more manual copy-pasting every week)
• Cleaning messy datasets with libraries like pandas
• Statistical analysis and early-stage machine learning
• Connecting to APIs and pulling in data SQL/Excel can’t easily reach
• Building custom visualizations with matplotlib or seaborn
You don’t need to become a software engineer to use Python as an analyst. Most of the heavy lifting happens through the pandas library, which handles tabular data (rows and columns) in a way that will feel familiar if you already know Excel or SQL.
4. BI Tools (Power BI / Tableau) — For Dashboards That Update Themselves
Business Intelligence tools are what turn your analysis into something leadership can check anytime, without needing you to run a new report every week.
What you’ll actually use it for:
• Interactive dashboards that update automatically as new data flows in
• Drill-down visuals that let non-technical users explore data themselves
• Connecting directly to databases, so reports don’t go stale
• Presenting KPIs in a way that’s visually intuitive at a glance
Power BI and Tableau both do similar jobs, but Power BI tends to be more common in companies already using Microsoft tools, while Tableau is popular for its polished visualization capabilities.
How These Tools Actually Work Together
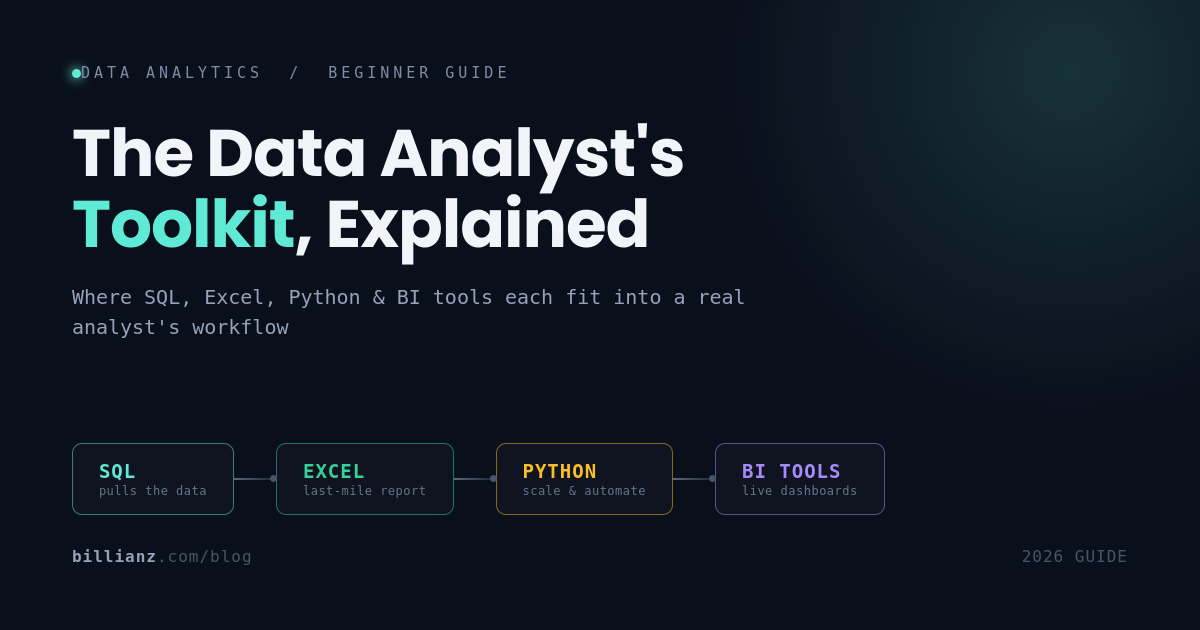
In practice, a single analysis task often moves through this pipeline:
1. SQL pulls the raw data from the company database
2. Python cleans, processes, or models that data if it’s messy or large-scale
3. Excel is used for a quick check or a smaller ad-hoc report
4. A BI tool turns the finished analysis into a live dashboard stakeholders can access anytime
Not every project uses all four — a simple weekly report might only need SQL and Excel, while a larger forecasting project might lean heavily on Python and a BI dashboard. Learning to recognize which tool fits which job is a skill in itself, and it’s exactly what separates a confident analyst from someone who just knows how to use software.
Where Should You Start?
If you’re a complete beginner, here’s a practical order:
1. SQL first — it’s the most universally required and directly transferable to real job tasks
2. Excel alongside it — you likely already know the basics; sharpen pivot tables and formulas
3. Python next — once you’re comfortable pulling and shaping data, Python lets you go further
4. A BI tool last — dashboards are easier to build once you already understand the data underneath them
You don’t need to be an expert in all four to land your first analyst role. Employers are usually looking for solid SQL fundamentals, working Excel skills, and exposure to Python and a BI tool — depth comes with experience on the job.